
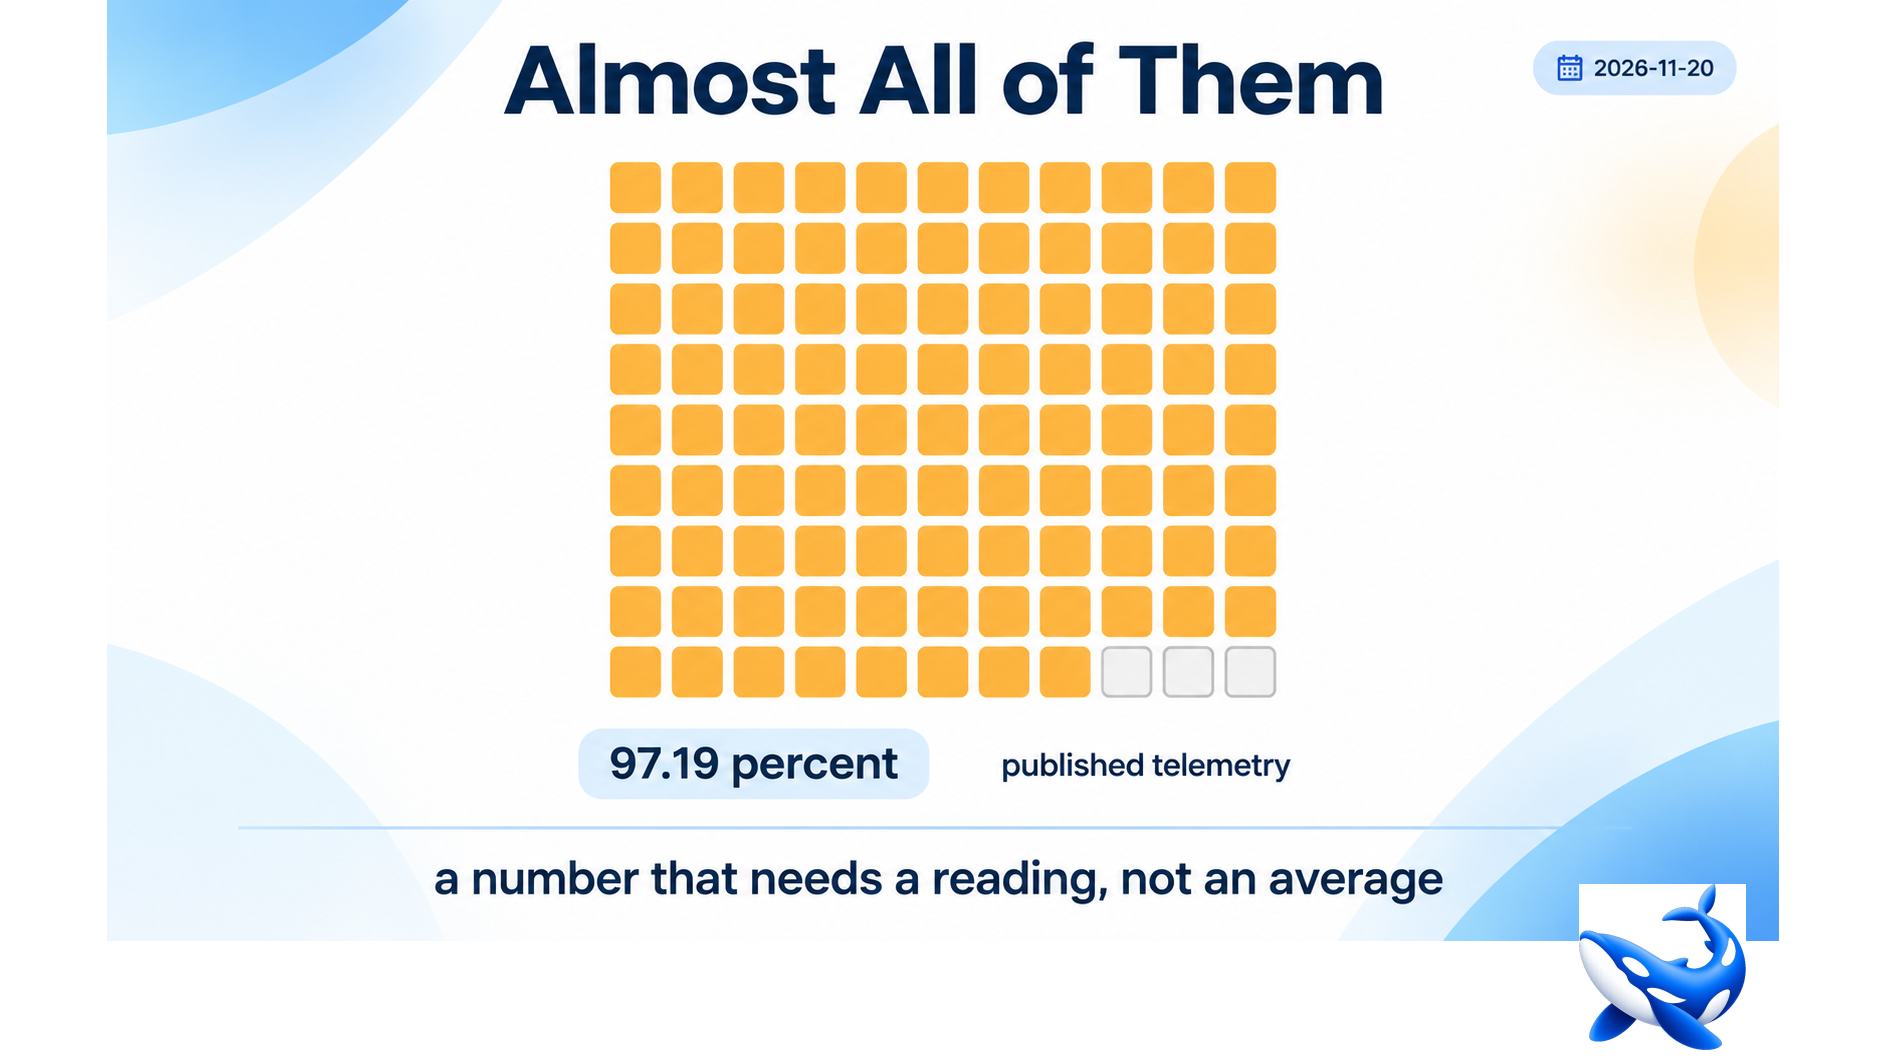
OrcaC2 1.0: A 97.19% Error Rate, and What It Probably Measures
Ninety-seven point one nine percent is the published error rate on this card, and it is the highest number the tier publishes by two orders of magnitude. OrcaRouter reports it as telemetry rather than as an estimate. It sits on OrcaC2 1.0 error rate beside a p50 of 800 milliseconds and 40,777 tokens of seven-day traffic.
The number, beside every other number
| card | err % |
| Zero 1.0 | 0.09 |
| Zero 1.5 | 0.09 |
| Hy4 | 0.10 |
| Flash 1.0 | 0.17 |
| Hy4 Flash | 0.17 |
| MiniMax M3.1 Flash | 0.18 |
| K3.1 Pro | 0.19 |
| MiMo V2.6 Flash | 0.42 |
| GLM 5.3 | 0.44 |
| GLM 5.3 Flash | 0.44 |
| Ultra 1.0 | 0.72 |
| Qwen3.8 Flash Next | 1.60 |
| OrcaC2 1.0 | 97.19 |
The next-highest card is Qwen3.8 Flash Next at 1.60%. This one is 61× that, and 1,080× the tier’s lowest.
An error rate above 90% is not a quality signal in the usual sense. No serving infrastructure that answers 800 milliseconds at p50 and 1,898 at p95 is failing 97% of real requests — a failing request does not return in under two seconds. The rate and the latency describe different populations, and the only reading that reconciles them is that most calls are being rejected rather than served.
The most likely explanation, marked as inference
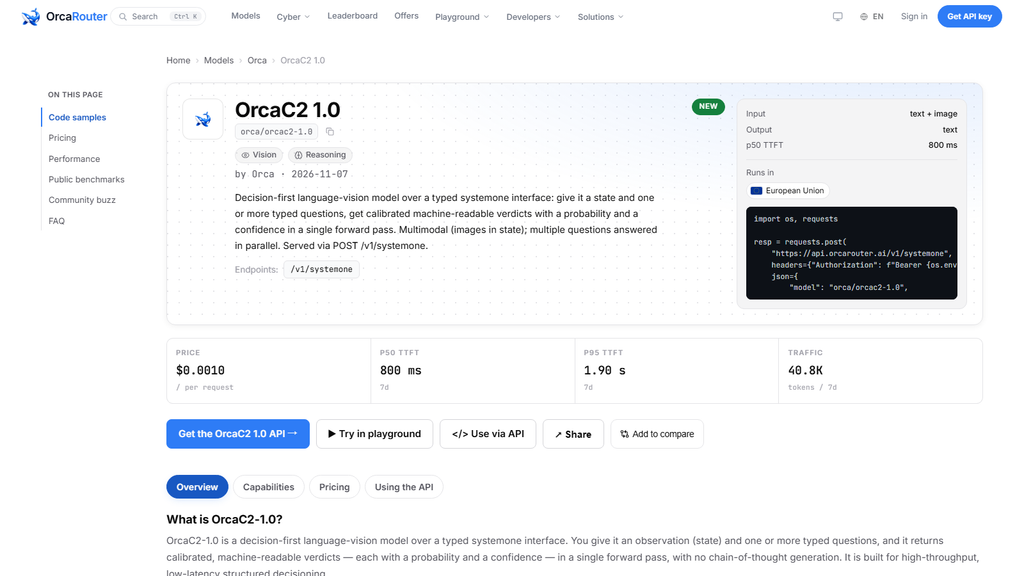
The card exposes exactly one endpoint: `POST /v1/systemone`. It is not `/v1/chat/completions`, and its request shape is a state plus one or more typed questions.
The published error rate is measured by the same playground probe that measures every other card’s. If that probe sends a chat-completions-shaped request, or a systemone request that does not match the typed schema the endpoint expects, it would be rejected — quickly, at the schema check, before any model work. A 1,898-millisecond p95 is entirely consistent with a validation rejection rather than a generation failure.
This is our inference, not a published finding. The card does not say what the probe sends or what the rejections are. What the published fields do establish is that the card returns in under two seconds at both percentiles, so the 97.19% cannot be timeouts on a 36.9-token-a-second model — a timeout on even a short generation would land near the p95, and the p95 is 1.9 seconds.
Two facts fit: fast rejections, or a very large population of malformed requests. One is a measurement artefact; the other is a real integration problem. The published data does not distinguish them.
The separate, independent data point is the traffic: 40,777 tokens in seven days. Whatever is happening, almost nobody is getting through.
What the traffic figure adds
Forty thousand tokens a week is four orders of magnitude below every other card in the tier. Hy4 Flash, which shipped two days before this measurement, has 1.01 billion.
| card | 7d tokens | age |
| Flash 1.0 | 36.72 B | 28 days |
| Hy4 Flash | 1.01 B | 2 days |
| OrcaC2 1.0 | 40.8 K | 13 days |
Thirteen days at 40,777 tokens is 3,137 tokens a day. At an implied 30 tokens a call that is about 104 successful calls a day — and if 97% of attempts fail, roughly 3,800 attempts a day.
Both readings are consistent with a card that is generally available but not yet integrated by anyone. The per-request price of $0.0010 also means the card’s entire seven-day bill would be about $3.80 even if every one of those attempts were billed, which is why the traffic figure does not show up in the tier’s spend at all.
So the honest summary is that this card has almost no usage, publishes one extreme number, and the number is more likely a measurement issue than a serving failure.
How to use it anyway
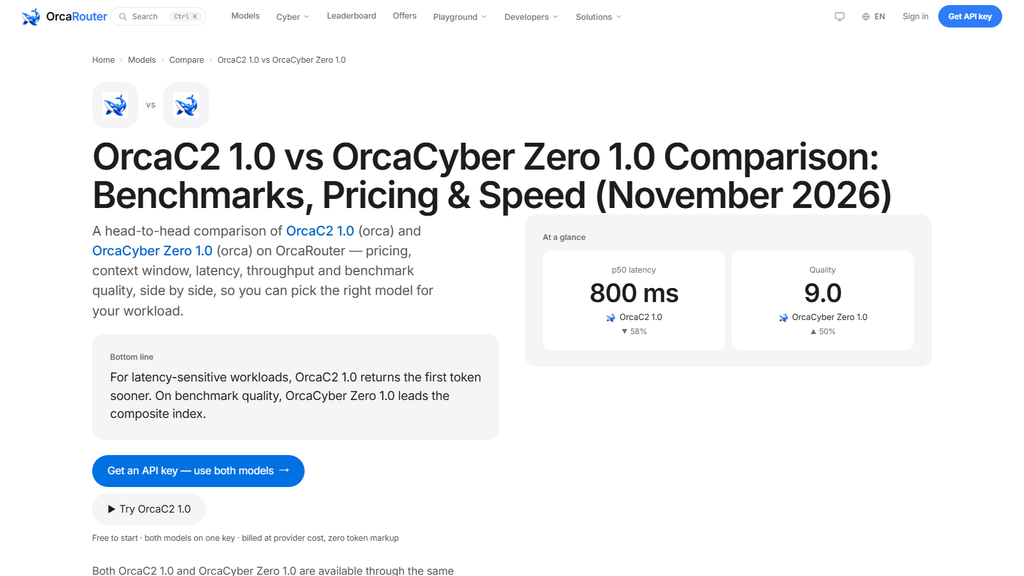
The card’s useful published properties are independent of its error rate. A p50 of 800 milliseconds is the second-fastest first-token latency in the tier, behind only Flash 1.0’s 940-millisecond… actually faster: 800 ms is the fastest in the tier. Its p95 of 1,898 ms is also the tightest spread in the tier — a 2.37× ratio between p95 and p50, against 5.99× on Flash 1.0 and 12.5× on Hy4 Flash.
| card | p50 | p95 | p95 ÷ p50 |
| OrcaC2 1.0 | 800 | 1,898 | 2.37 |
| Flash 1.0 | 940 | 5,626 | 5.99 |
| K3.1 Pro | 1,069 | 9,765 | 9.13 |
| Zero 1.5 | 1,394 | 10,000 | 7.17 |
| GLM 5.3 | 3,411 | 9,880 | 2.90 |
| Hy4 Flash | 3,579 | 9,834 | 2.75 |
| Hy4 | 3,599 | 8,930 | 2.48 |
| GLM 5.3 Flash | 4,144 | 10,000 | 2.41 |
A 2.37 ratio means the tail is close to the middle, which is what a deterministic schema check produces and what a variable-length generation does not. That supports the rejection reading.
For a team that wants to evaluate the card, the first step is a single request through the exact endpoint with the exact typed schema, on a credential that has access. One call settles whether the 97.19% is a probe artefact or a real integration problem, and it costs a tenth of a cent.
What a 97% rate would look like if it were real
Take the published rate at face value and follow it through, because the arithmetic is the argument.
| quantity | value |
| tokens served in 13 days | 40,777 |
| tokens per day | 3,137 |
| requests per day at 30 tokens | ~104 |
| attempts per day at 97.19% failure | ~3,700 |
| attempts per second | ~0.04 |
Three thousand seven hundred attempts a day on an endpoint that is supposed to be in production is four hundredths of a request a second. That is not a serving pattern; it is a probe.
A real 97% failure rate on real traffic would empty a customer base within a day. Nobody keeps sending requests to an endpoint that rejects nineteen of every twenty.
So the rate describes a population of calls that are being made deliberately and failing systematically — which is what a health probe or a schema-conformance check produces when it sends the wrong shape.
The p50 of 800 ms and p95 of 1,898 ms fit that reading. A validation rejection returns quickly; a generation failure usually does not. These are rejection latencies.
None of this is in the published fields, and all of it is marked as inference rather than stated as fact. What the fields do support is narrower and still useful: this endpoint has almost no traffic, publishes one extreme number, and the number is more consistent with a measurement mismatch than with a broken service.
There is also a structural point worth stating. This endpoint is not a chat-completions surface — it takes two parameters and one route. A probe built for the rest of the tier would send a shape this endpoint does not accept, and a rejection at the schema check is fast, cheap and counted as an error. The published p50 of 800 milliseconds is consistent with exactly that.
OrcaC2 1.0 publishes a 97.19% error rate — 61× the next-highest card and 1,080× the tier’s lowest — alongside 40,777 tokens of seven-day traffic and a p50/p95 pair of 800 and 1,898 milliseconds.
An 800-millisecond median rules out timeouts, and the tier’s tightest p95-to-p50 ratio of 2.37 rules out variable-length generation. The reading that fits both is that most calls are rejected at the typed-schema check on the single `/v1/systemone` endpoint; that is our inference, and one call through the correct schema would settle it. Both figures are published as telemetry.
Its 800 ms first-token latency is nonetheless the fastest in the tier, and at $0.0010 a request the whole week’s usage would bill under four dollars.
Sourcing note: the error rate, p50 and p95 latency, throughput, per-request price, endpoint list, supported parameters and seven-day token volume are read from the OrcaC2 1.0 model API and card page on orcarouter.ai on 2026-11-20, with all performance figures being OrcaRouter production telemetry for the seven days to that date. The explanation for the error rate is our inference and is marked as such on the page; the card states neither the probe shape nor the rejection reason. The implied call counts are our own arithmetic. No competitor product is named or compared. Checked 2026-11-20.