
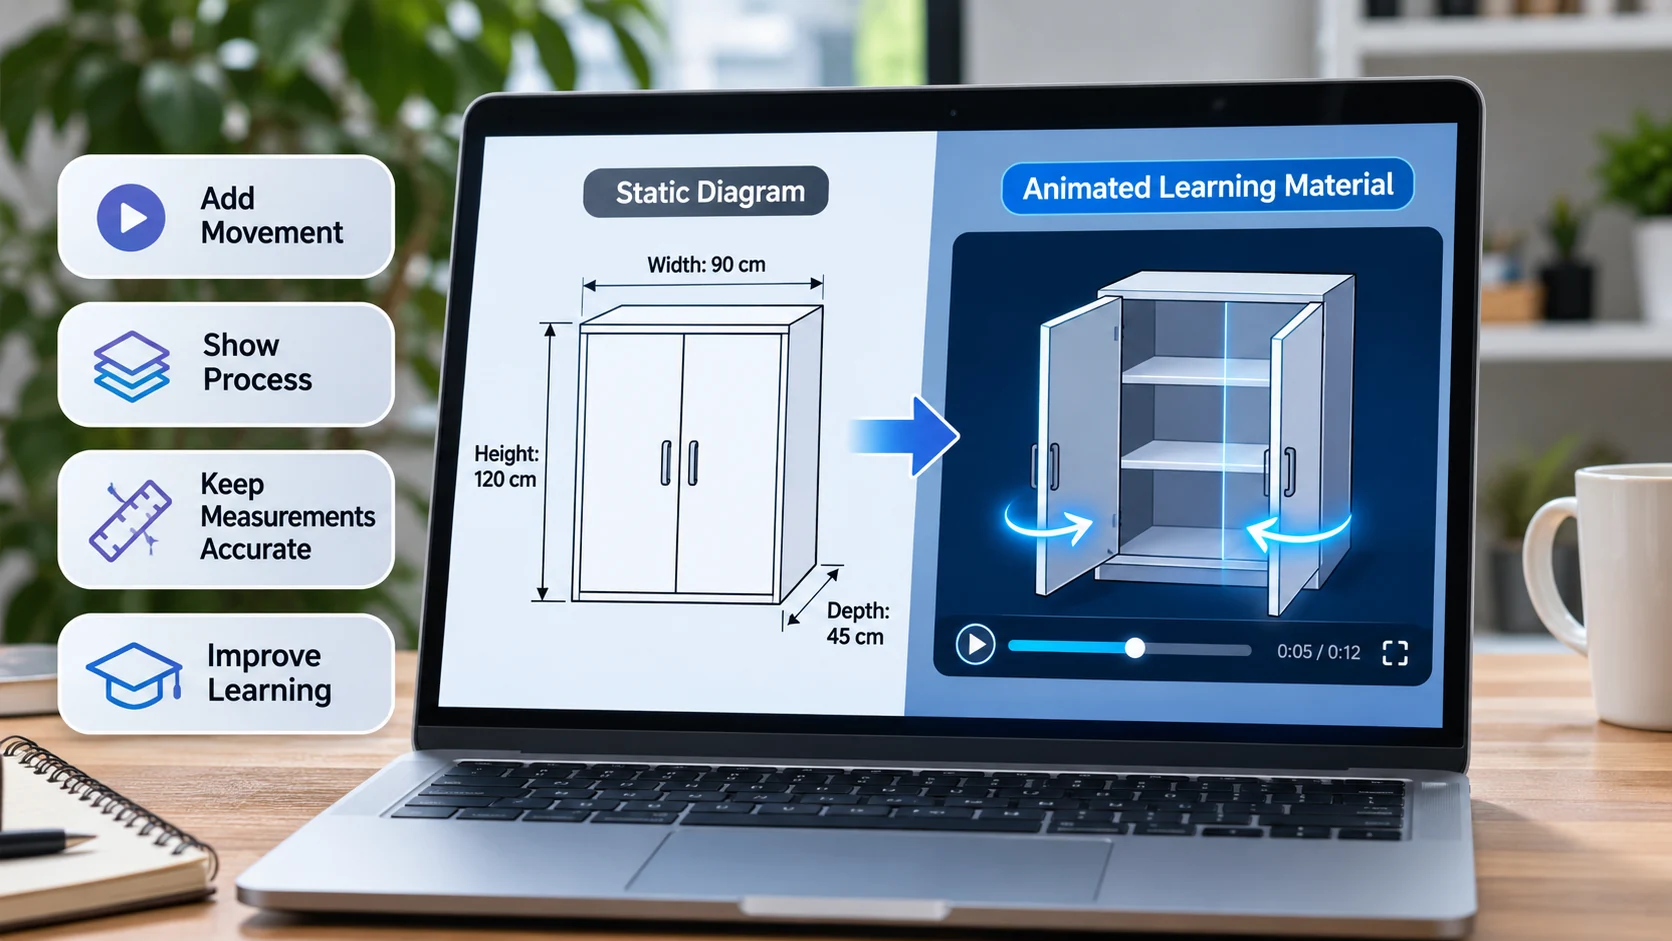
How Do You Turn Static Diagrams Into Animated Learning Materials?
Meta Description: Learn how to turn static diagrams into animated learning materials using practical tools, clear visuals, accurate measurements, and simple animation techniques.
Static diagrams explain the structure of objects and systems, but they cannot always show how things change or work together. Animated learning materials address this limitation by adding movement, sequence, and visual guidance to ordinary illustrations. Educators, designers, and content creators can animate images to demonstrate measurements, explain technical processes, and make complex subjects easier to follow. This guide covers the tools, techniques, and practical steps needed to create educational animations that support better visual learning.
What Are Animated Learning Materials?
Animated learning materials are educational visuals that use movement to communicate concepts, relationships, or processes. They transform fixed diagrams into sequences that guide viewers through information in a planned order.
Unlike static illustrations, which display all information simultaneously, animated diagrams can introduce individual components as a lesson progresses. For example, a drawing of a mechanical device may identify its parts, while an animated version demonstrates how those parts interact during operation.
This approach is useful in mathematics, science, architecture, engineering, and product design. These subjects often involve spatial relationships, changes in position, or processes that unfold over time.
Static diagram: A fixed illustration that represents an object, process, structure, or set of measurements.
Animated diagram: A visual explanation that uses motion or transitions to demonstrate changes, relationships, or sequences.
An animated diagram does not need elaborate effects. Even a simple sequence of highlighted arrows or changing labels can make a technical explanation more informative.
Key Insight: Educational animation adds a time-based explanation to a static visual, allowing learners to follow concepts in a structured sequence.
Why Are Animated Diagrams Useful for Learning?
The main advantage of animation is its ability to demonstrate information that would otherwise require several separate illustrations or lengthy written explanations.
For instance, a single diagram of a folding mechanism can show its parts and dimensions. However, explaining how the mechanism opens and closes may require multiple drawings. Animation combines these stages into one continuous demonstration, making the relationship between movement and structure easier to observe.
Animations also allow educators to control when information appears. This technique, often called progressive disclosure, introduces details only when viewers need them. It can help prevent a complex visual from becoming overwhelming.
Understanding Changes and Processes
Some subjects are difficult to explain through fixed images because their meaning depends on change.
Examples include:
- Showing how gears transfer motion between connected components.
- Demonstrating how a geometric shape rotates around an axis.
- Explaining how water moves through a drainage system.
- Illustrating how furniture components fit together during assembly.
In each case, movement communicates information that a single static drawing cannot fully capture.
Supporting Learner Participation
Animated materials can also encourage exploration when paired with interactive controls.
Students might pause a geometric transformation, predict the next stage, and compare their answer with the animation. In a technical lesson, they could replay a particular movement to understand why one component affects another.
However, animation should not replace clear instruction. Its educational value depends on whether the movement directly supports the intended learning outcome.
How Should You Prepare a Diagram Before Animating It?
A successful animation begins with a reliable source diagram. If the original contains incorrect proportions, unclear labels, or unnecessary details, adding motion may make those problems more noticeable.
Start by reviewing the image and identifying which elements contribute to the explanation. A technical drawing may contain reference lines, measurement indicators, object outlines, and descriptive labels. Decide which should remain fixed and which should change during the animation.
Check Image Quality and Measurement Accuracy
Choose an illustration with enough resolution to remain clear when displayed on different screens. Vector formats such as SVG are especially useful because they support resizing without pixelation.
When working with measurements, verify that numerical labels match the object being represented. For example, a cabinet drawing should distinguish between width, height, and depth without placing indicators in confusing positions.
Websites that focus on size and dimension information can provide relevant context for educational content involving object measurements, proportional comparisons, and spatial planning.
Preserving measurement relationships is essential when demonstrating real-world objects. An animation that unintentionally stretches a diagram may give learners the wrong impression about its dimensions.
Organize the Diagram Into Layers
Once the source image is ready, divide it into elements that can be controlled separately.
Consider an illustration of a staircase. It might contain the steps, handrail, height indicators, width arrows, and text labels. Placing these elements on individual layers allows each one to appear or move without affecting the others.
Before animation, complete these tasks:
- Remove decorative elements that do not support the lesson.
- Separate moving components from stationary objects.
- Group related labels and measurement indicators.
- Check the readability of text and symbols.
- Save an unchanged copy of the original illustration.
This preparation creates a more flexible working file and reduces the need for corrections later.
How Do You Animate Images Step by Step?
Creating animated educational content requires a clear plan rather than complicated software skills. The following workflow works for basic classroom visuals and more detailed technical demonstrations.
Step 1: Identify the Concept You Want to Explain
Begin with a specific learning objective.
Suppose you want students to understand the difference between radius and diameter. The animation should focus on the center of a circle, the line from the center to its edge, and the full distance across the circle.
Avoid introducing unrelated formulas or geometric properties unless they are necessary for the explanation.
Step 2: Choose the Right Software
Different animation tools offer different levels of control.
| Tool | Best use |
| Microsoft PowerPoint | Basic diagram reveals, labels, and classroom presentations |
| Canva | Simple animations for educational graphics and digital lessons |
| Adobe After Effects | Detailed motion graphics and layered technical illustrations |
| Blender | Three-dimensional objects, rotations, and mechanical demonstrations |
Presentation tools are generally enough for introductory lessons. More advanced software becomes useful when the subject requires precise motion, camera movement, or three-dimensional modeling.
Step 3: Build a Visual Sequence
Plan the order in which information should appear.
For a circle measurement lesson, the sequence might be:
- Display the complete circle.
- Mark its center point.
- Draw a line from the center to the circumference.
- Label that line as the radius.
- Extend the line across the circle through its center.
- Introduce the diameter and explain its relationship to the radius.
A simple storyboard helps organize these stages before editing begins.
Step 4: Apply the Appropriate Animation Effects
Select effects based on the information being demonstrated.
Fades work well when introducing labels. Motion paths can illustrate the movement of mechanical components. Rotation helps explain changes in orientation, while highlighting can direct attention toward important areas.
Use consistent transitions throughout the lesson. Unnecessary effects may distract viewers from the explanation.
Step 5: Add Supporting Information
Text and narration should clarify what viewers see rather than describe every visible action.
For example, when demonstrating diameter, a short label stating “Diameter = 2 × Radius” may provide enough context if the animation already shows the relationship.
Long explanations can appear separately as captions, narration, or supporting lesson notes.
Step 6: Export and Check the Result
Choose an output format that matches the intended learning environment.
MP4 is suitable for video lessons and most learning platforms. GIF works for short, silent demonstrations, although it lacks audio and playback features commonly available in video players.
Before publishing, check the sequence on both large and small screens to confirm that important details remain visible.
Practical Tip: Plan the visual sequence before applying animation effects. This keeps the lesson focused and prevents unnecessary editing.
How Can Animation Explain Size, Scale, and Dimensions?
Measurements are an especially useful application of educational animation because learners often need to connect abstract numbers with physical objects.
A static measurement chart may identify several dimensions, but animation can show where each measurement begins, how it extends across an object, and why it matters.
Teaching Length, Width, and Height
Consider a rectangular storage box.
An animation can display the box in three dimensions and introduce measurement indicators along its edges. A horizontal line identifies its length, another shows its width, and a vertical arrow represents its height.
After learners recognize the three dimensions, the lesson can introduce the formula for volume:
Volume = Length × Width × Height
For a box measuring 40 cm long, 30 cm wide, and 20 cm high, the calculation becomes:
40 × 30 × 20 = 24,000 cm³
The animation can connect each number in the formula to its corresponding edge, helping viewers understand where the values originate.
Demonstrating Scale Drawings
Scale is another concept that benefits from visual demonstration.
Suppose an architectural drawing uses a scale of 1:50. This means that 1 cm on the drawing represents 50 cm on the actual object.
An animation can place the scaled drawing beside a representation of the real structure, then highlight corresponding measurements.
This comparison demonstrates how scale changes the displayed size while preserving the relationship between dimensions.
Visualizing Spatial Planning
Animated diagrams can also help explain how objects fit within available spaces.
For instance, a lesson might show a desk moving into a room layout. Measurement indicators could reveal whether the desk fits along a wall and how much clearance remains for movement.
This application connects dimension data with practical decisions in interior design, furniture planning, and product placement.
What Makes an Educational Animation Accessible and Effective?
An educational animation should communicate information to viewers with different learning preferences, abilities, and devices.
Accessibility begins with readable visual elements. Text should remain large enough to recognize, and important information should not depend on color alone. For example, measurement indicators can use both color and written labels to distinguish dimensions.
Provide Playback Control
Some learners need more time to process visual changes, especially when the subject involves calculations or unfamiliar technical terms.
Allowing viewers to pause, replay, or move through a lesson at their own pace can improve usability.
The World Wide Web Consortium explains relevant accessibility practices in its WCAG guidance on pausing, stopping, and hiding moving content.
These recommendations are especially relevant when content moves automatically and may distract users from other information.
Support Visuals With Alternative Explanations
Provide captions for narrated lessons and written descriptions of essential visual information.
The W3C guidance on non-text content explains the importance of text alternatives for meaningful visual content.
For example, a diagram showing a rotating triangle could include a description of its starting position, direction of rotation, and final orientation.
These details help learners understand the concept even when they cannot fully perceive the animation.
Match Timing to the Lesson
Timing should reflect the complexity of the material.
A basic arrow reveal may need only a brief transition. A demonstration involving several calculations should allow more time for reading and interpretation.
Instead of using the same speed for every effect, adjust the pacing around the information being presented.
What Mistakes Can Reduce the Quality of Animated Diagrams?
Even well-designed graphics can become confusing when animation choices interfere with the lesson.
One frequent issue is excessive movement. If multiple objects rotate, fade, and change position simultaneously, viewers may struggle to identify the main point.
Another problem involves technical accuracy. Stretching an engineering illustration or changing the relative size of components can distort the information being taught.
Creators should also avoid treating animation as a substitute for explanation. A moving object may demonstrate what happens without explaining why it happens.
Before publishing, review these common problem areas:
- Visual overload: Too many moving elements compete for attention.
- Incorrect proportions: Distorted shapes create misleading technical representations.
- Unclear sequence: Information appears before viewers understand the previous stage.
- Poor text placement: Labels overlap objects or disappear too quickly.
- Missing context: The animation shows an action without explaining its purpose.
A useful quality check is to ask someone unfamiliar with the subject to watch the animation and describe what they learned. Their response can reveal gaps that are difficult to notice during production.
How Do You Know Whether an Animated Lesson Works?
The success of an educational animation should be judged by what learners understand after viewing it, not simply by how polished it looks.
One practical method is to compare performance before and after the lesson.
For example, students learning about object dimensions could first identify the width, depth, and height of several drawings. After watching an animated demonstration, they could complete a similar activity using different objects.
Improvement may suggest that the lesson helped, although other factors can also influence results.
Educators can gather useful feedback through short questions:
- Which part of the animation was easiest to understand?
- Did any section move too quickly?
- Were the labels and explanations sufficient?
- Could you apply the concept to a new example?
When lessons are published online, replay activity and completion rates may help identify sections that deserve attention. However, these measurements should support, rather than replace, direct assessments of understanding.
Use the findings to refine future lessons, whether that means changing the sequence, simplifying a diagram, or adding another example.
Frequently Asked Questions
Can Beginners Create Animated Diagrams Without Professional Software?
Yes. Tools such as PowerPoint and Canva support basic animations, including object reveals, movement, and text transitions. Beginners can create practical educational visuals without advanced editing experience.
Which File Format Is Best for Animated Learning Materials?
MP4 is a practical choice for complete video lessons, while GIF works for short, silent demonstrations. SVG is useful for preparing editable source diagrams before animation.
Can Animated Diagrams Be Used for Technical Measurements?
Yes. They can demonstrate measurement points, compare object dimensions, explain scale, and show spatial relationships. Maintaining accurate labels and proportions is essential.
How Long Should an Educational Animation Be?
The duration depends on the subject. A simple concept may require less than a minute, while a detailed technical process may need several minutes. Each stage should receive enough time for viewers to understand it.
Is Narration Necessary for Every Animated Diagram?
No. Short animations can communicate effectively through labels and visual cues. Narration is more useful when the lesson includes complex processes, calculations, or explanations that cannot fit comfortably on screen.
Conclusion
Turning static diagrams into animated learning materials involves more than adding movement to an illustration. It requires understanding the subject, selecting the right visual sequence, and presenting information in a way that supports learning.
Technical diagrams, measurement charts, geometric illustrations, and spatial layouts can all benefit from carefully planned animation. The most useful results come from accurate source materials, appropriate software, accessible presentation, and feedback from real learners.
As educational content continues to combine written explanations with visual demonstrations, creators who animate images with a clear instructional purpose can make complex information more approachable.
Final Takeaway: Effective diagram animation combines accurate information, purposeful movement, and learner-focused design to turn static visuals into practical educational resources.